


This is the year when the biggest political and economic conundrum to face the U.K. in modern times will be solved, further complicated or even abandoned in all but name.
 A mural by street artist Banksy depicting a EU flag being chiseled by a workman covers the side of a building in Dover.
Within 10 months, the British government and European Union aim to have an agreement on their divorce and at least the outline of their future trading relationship. They have different ideas about what Brexit should look like and different views on how the talks themselves should be ordered.
Then there are the divisions within each camp. The U.K.’s governing Conservatives, whose decades-old rift over EU membership was the catalyst for Brexit, remain split over what it really means. The opposition Labour Party is avoiding the question, and the Scottish nationalists don’t want to leave at all.
The EU may be putting its unity before any other priority, but negotiations could reveal conflicting national interests among the remaining 27 members.

So after a year of flawed predictions, here’s a look at several scenarios that just might come to pass in 2018.
The Base Case
While the U.K. wants the full trade deal done by the time it leaves on March 29, 2019, the EU wants it ready to go by January 2021. This is what EU experts reckon could happen:
After a couple of months of uneventful talks, an agreement is reached on the transition deal that businesses have been crying out for. It’s not legally binding yet, but it’s enough to prevent a mass exodus of companies. In March, trade discussions start.
The U.K. fights for the City of London, but soon realizes that all the banks have contingency plans anyway and a fair amount of business will still be done in London after the split. The EU won’t budge on its refusal to let the U.K. keep the best bits of membership and Prime Minister Theresa May’s Conservatives won’t let her make the concessions that would be needed to remain in the EU’s single market.
In October there’s an outline agreement, which is vague, but detailed enough to be clear that Britain is headed for a trade deal that’s a lot like the one Canada struck with the EU.
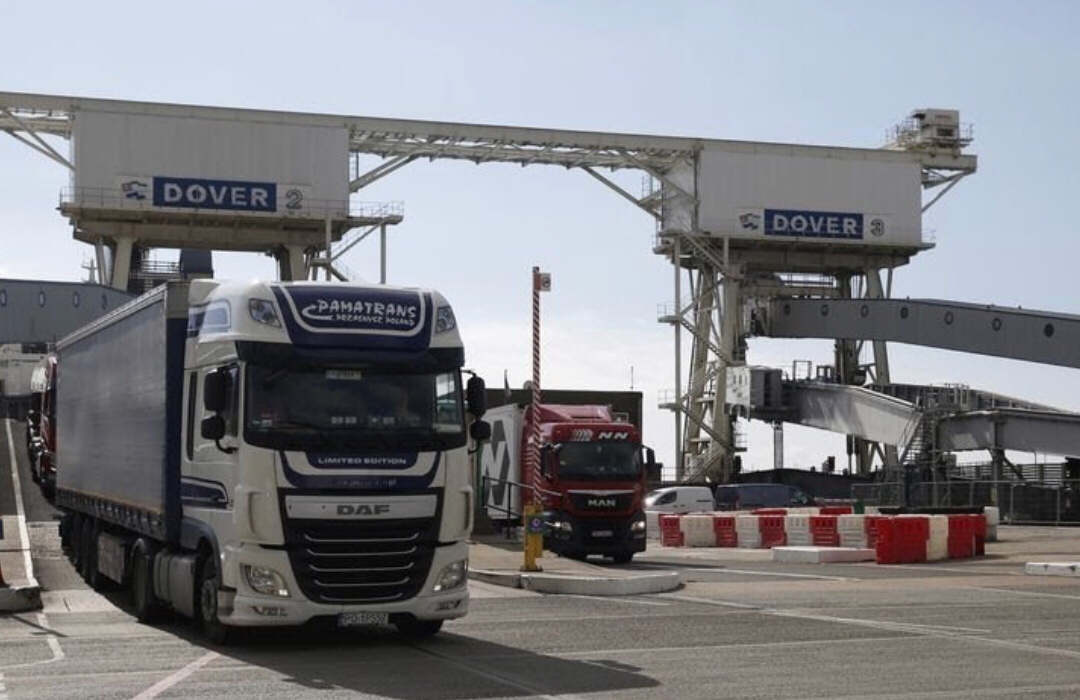 Cargo trucks disembark a cross channel ferry at the Port of Dover.
It will keep tariffs off most goods, but put up barriers at customs and won’t do much for the service industries that make up most of the U.K. economy. Carsten Nickel of Teneo puts the chances of this scenario at about 60 percent.
The Irish border is back as a major obstacle. In the end, May calls the bluff of her Northern Irish allies in the Democratic Unionist Party and they accept that in some areas they will have different rules to the rest of the U.K. to keep the border with the Republic of Ireland open.
The Upset
Talks on transition go well enough. Then, by October, it’s clear negotiations on the future trade partnership are failing. The question of how to keep the Irish border open without a customs agreement rears its head again.
This time, it proves impossible for May to satisfy her three most difficult audiences: the Irish government, which is backed by the EU; the Democratic Unionist Party, which is propping up her government; and the ardent Brexit-backers within her own party.
Despite two weeks of crisis talks with the DUP, no deal is reached. May’s minority government collapses and an election is called for Thursday Nov. 15. The Conservatives have no time to choose a new leader so against the odds May takes the party into the short campaign.
On election day, the first in the fall since 1974, voter turnout is down. Labour manages to mobilize the youth vote while elderly Conservatives stay at home on a damp autumn day. Shortly before dawn, Corbyn is declared the winner and becomes prime minister with a small majority of 20. Once in government, Labour’s policy moves toward closer ties with the EU.
By December, the time for talking is over as Brexit day looms. At an emergency negotiating session on Christmas Eve, the U.K.’s chief negotiator, Keir Starmer, accepts the EU’s offer of membership of the European Economic Area.
It means Britain will maintain full access to its biggest market for goods and services, but now has to accept rules it has no say in making. It has also failed to “take back control” of immigration, a major issue in the Brexit debate.
The Walkout
Talks on transition take longer than the U.K. hoped and the start of proper trade discussions is delayed. It soon becomes clear that the services industry is going to be largely left out of the future trade deal.
Businesses squeal and Brexit-backers at home wonder in public why May agreed to pay a hefty divorce bill in return for such a bare-bones trade deal. Loose ends that weren’t properly tied up in the first few months of talks continue to dog discussions.
The EU again reminds the U.K. that it needs to find a way to keep the Irish border open after the split, but it won’t give an inch to help find a solution.
The Wish
Talks on trade and transition start quickly in January and by February a deal on transition is agreed.
The U.K. convinces the EU that it should offer it a “Canada plus, plus, plus” deal. That means a broad trade agreement that keeps tariffs off goods and also allows services companies, including banks, to continue to operate across the continent. The EU was divided on financial services but the pragmatists in Europe win the day.
Britain also convinces the EU that it needs to get a fully detailed trade agreement drafted in time for exit day so that it can be signed immediately after Brexit. Businesses and customs officials now have a palatable two years to prepare for the shift to the new arrangement.
Source: Bloomberg
In global rankings Sweden frequently appears at or near the top. It doesn’t really matter what type of survey, you will find my country at the top anyway.

If you’re Swedish, you should be feeling pretty proud of yourself right now. Here’s a few reasons why.
It’s easy to do business there
It’s really easy to do business in Sweden. So much so that it now ranks number one on the Forbes’ annual list of the Best Countries gor Business. Compare that to economic powerhouse the US, which is in 23rd place.
Ten years ago, Sweden ranked no 17, but since then it has embarked upon a number of initiatives that have propelled it to the top. “Over the past two decades the country has undergone a transformation built on deregulation and budget self-restraint with cuts to Sweden’s welfare state,” says Forbes. It is also home to plenty of tech innovation and to “some of the most venerable, well-known brands in the world, including Volvo, Electrolux, Ericsson, IKEA and H&M.”
Forbes graded 139 countries on 11 factors including, innovation, taxes, technology, levels of bureaucracy and stock market performance.
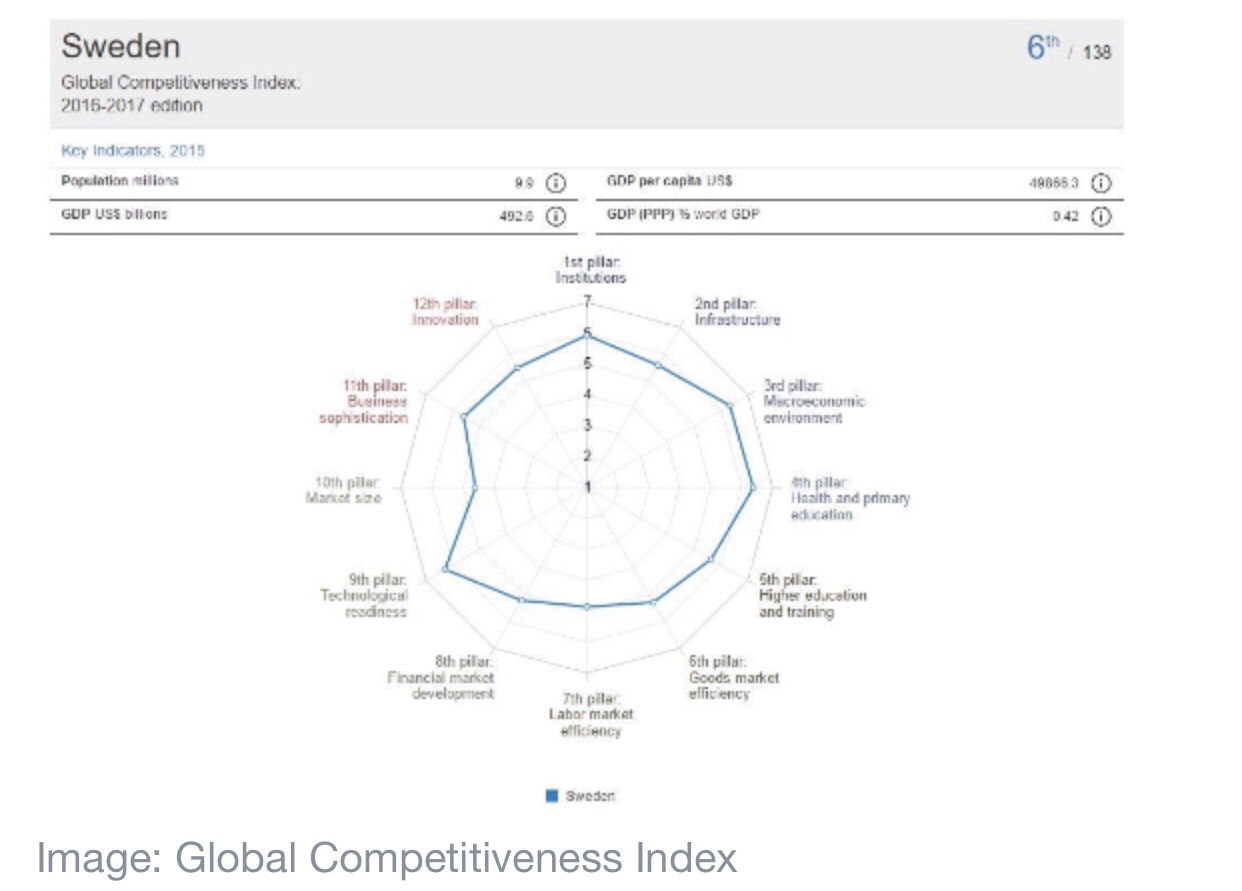
It is globally competitive
The World Economic Forum publishes a Global Competiveness Index every year, and this year it put Sweden in sixth place. “Growth has been robust, at 3.7 percent in 2016, and the country has managed to significantly decrease its deficit in 2015, jumping 30 places to 22nd on this indicator.
“The labour market functions reasonably well and Sweden has a high employment rate, with a high level of women’s participation in the workforce.”
It has good gender equality
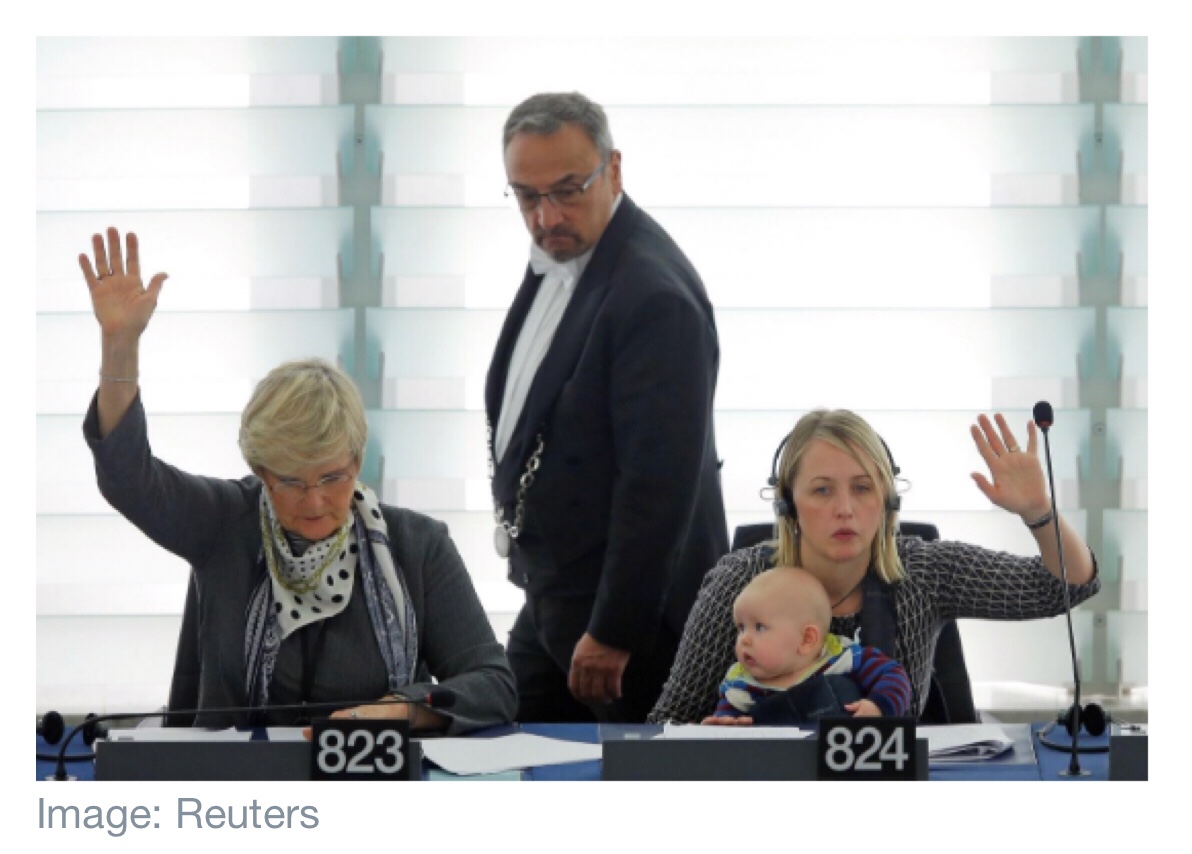
Sweden is placed 4th on the World Economic Forum’s Global Gender Gap Index, having closed more than 81% of its overall gender gap. It has recently seen an increase in female legislators, senior officials and managers, and has reached parity in the number of women in ministerial positions.
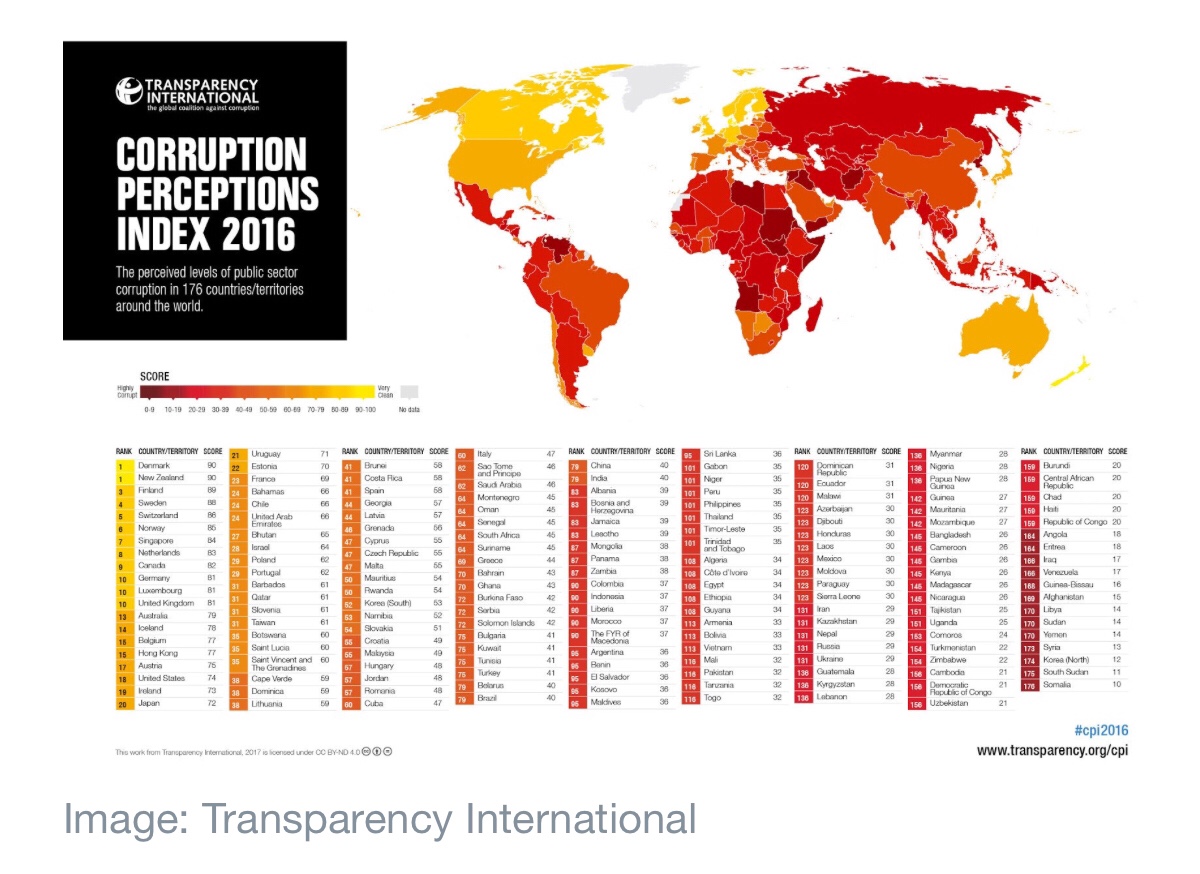
It has low levels of corruption
Sweden has a low level of corruption and ranks 4th in Transparency International’s latest Corruption Perceptions Index which measures the perceived levels of public sector corruption in 186 countries.
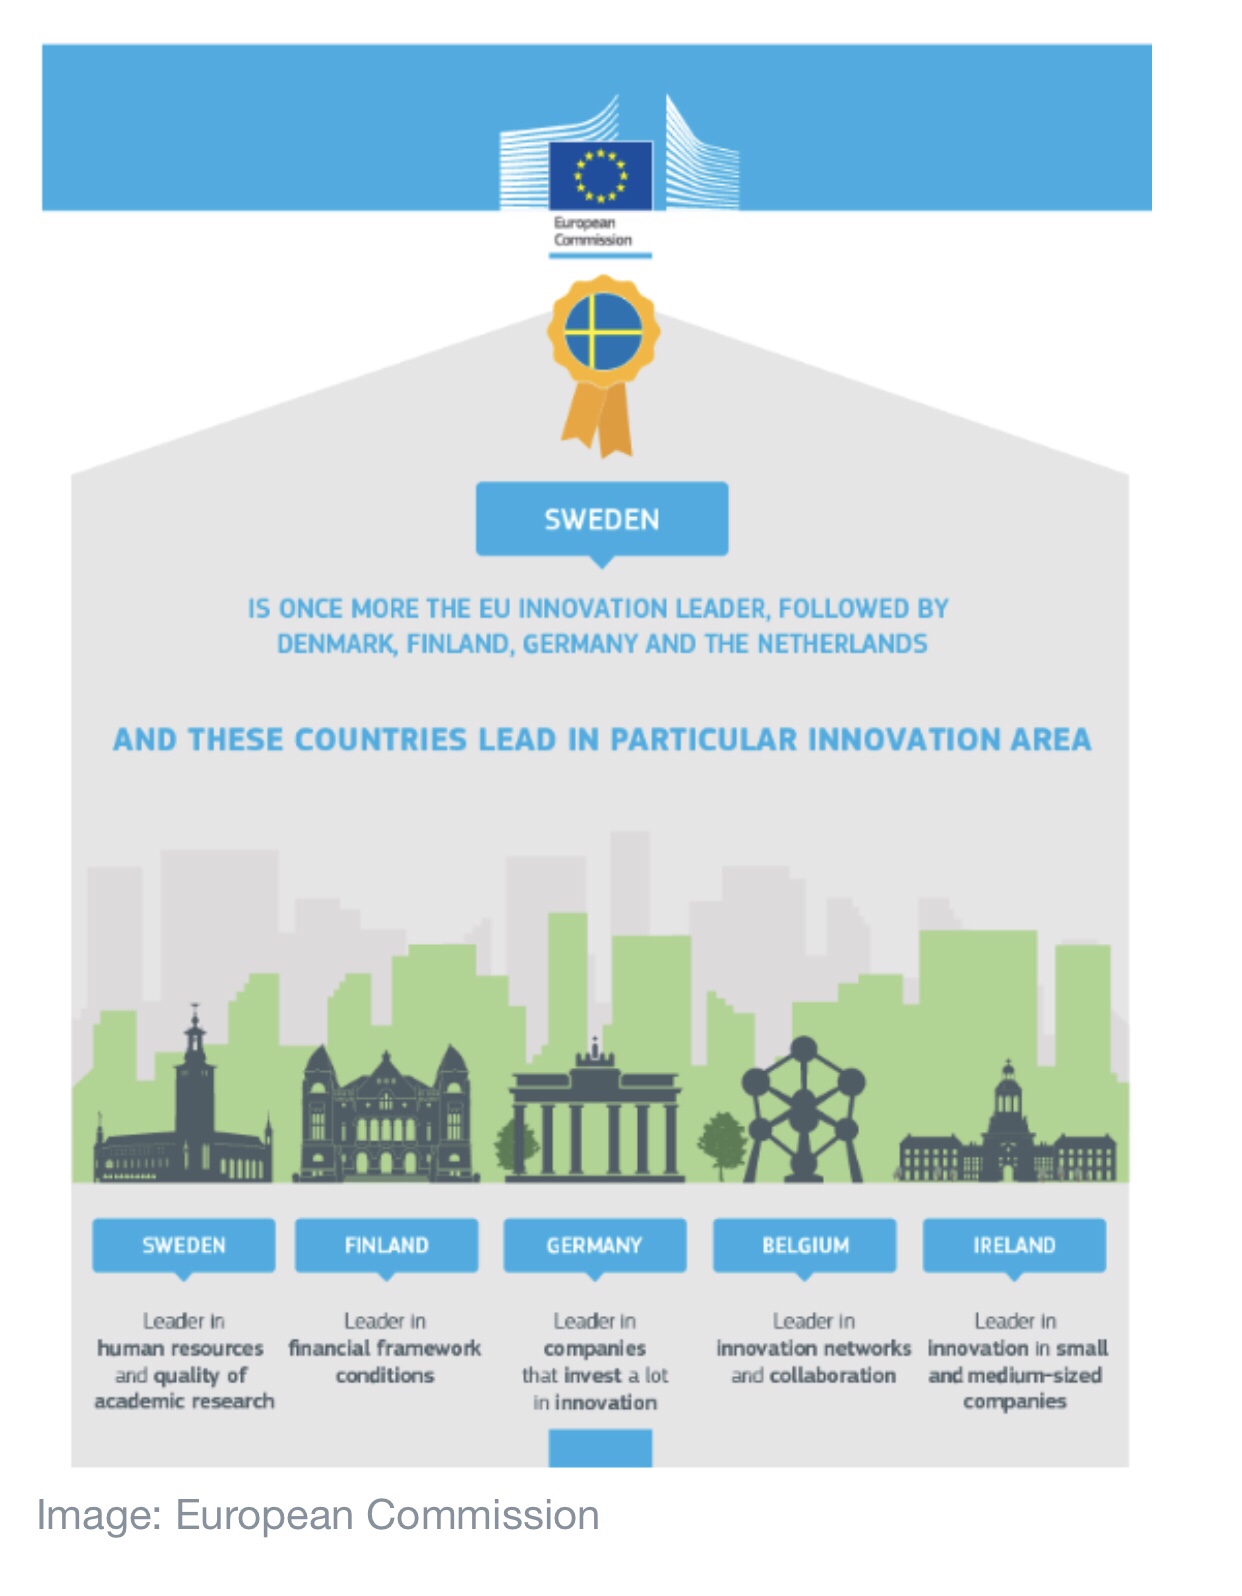
It’s highly innovative
The European Commissions’s European Innovation Scoreboard Index places Sweden in top place. Alongside Denmark, Finland, Germany, the Netherlands, Sweden is an “Innovation Leader” with innovation performance well above that of the EU average, according to the study.
Innovation performance is measured by average performance on 25 indicators. Sweden leads in human resources – the availability of a high-skilled and educated workforce – and quality of academic research.
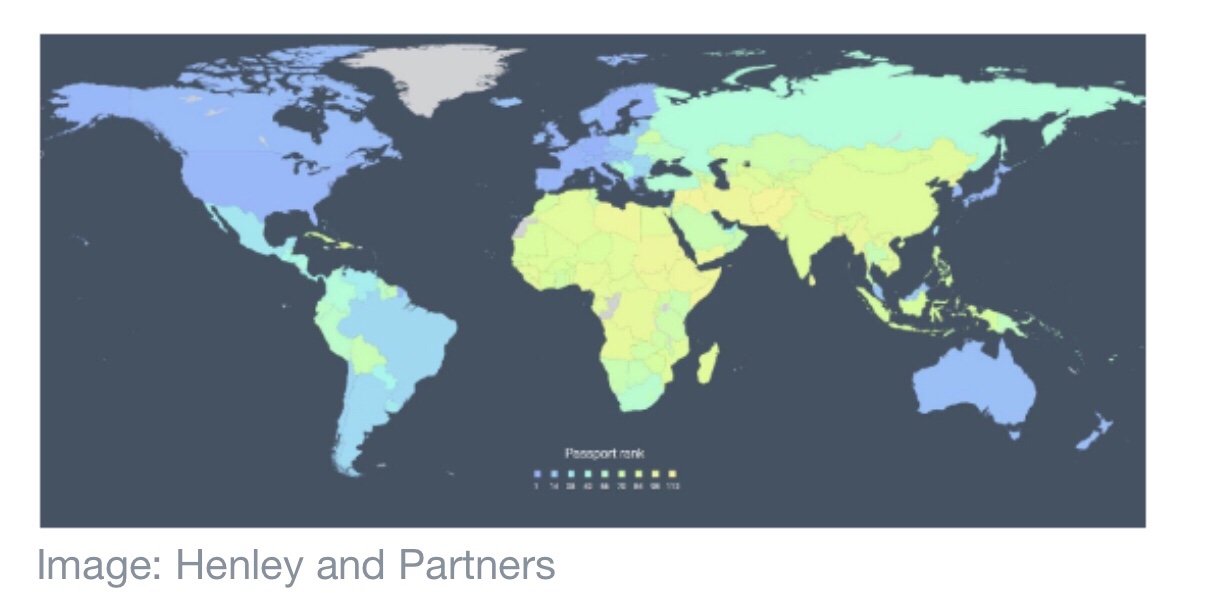
It has a powerful passport
The power of a passport is defined as how many countries the holder has unfettered access to. Germany and Sweden top the list, with only one country between them. This makes the Swedish passport the second most powerful in the world.
The ranking, compiled by Henley & Partners, a citizenship and planning firm, takes into account how many countries can be visited without applying for a visa. German passport holders can travel to 177, out of a possible 218, while Swedes can visit 176.
It’s a great place to grow old
Sweden ranks third overall in the Global AgeWatch Index which measures the quality of life for older people. Sweden’s strengths lie in the capability of its older generation – they have above average employment rates (73.6%) and levels of educational attainment (68.7%).
Older people are highly satisfied with safety (73%), civic freedom (94%) and public transport (65%). Sweden also ranks high on the income security domain (7), with 100% pension income coverage and an old age poverty rate (5.3%) that is 3% below the regional average.
Language skills
Swedes speak very good English, and are only beaten to the top by The Netherlands and Denmark. The ranking, which is compiled by language education company Education First, is the result of testing millions of people all over the world on their language skills.
English has been a compulsory subject throughout primary and secondary school in Sweden for the last four decades, and daily life in the region is characterized by constant exposure to English through non-dubbed English-language media, particularly on television.
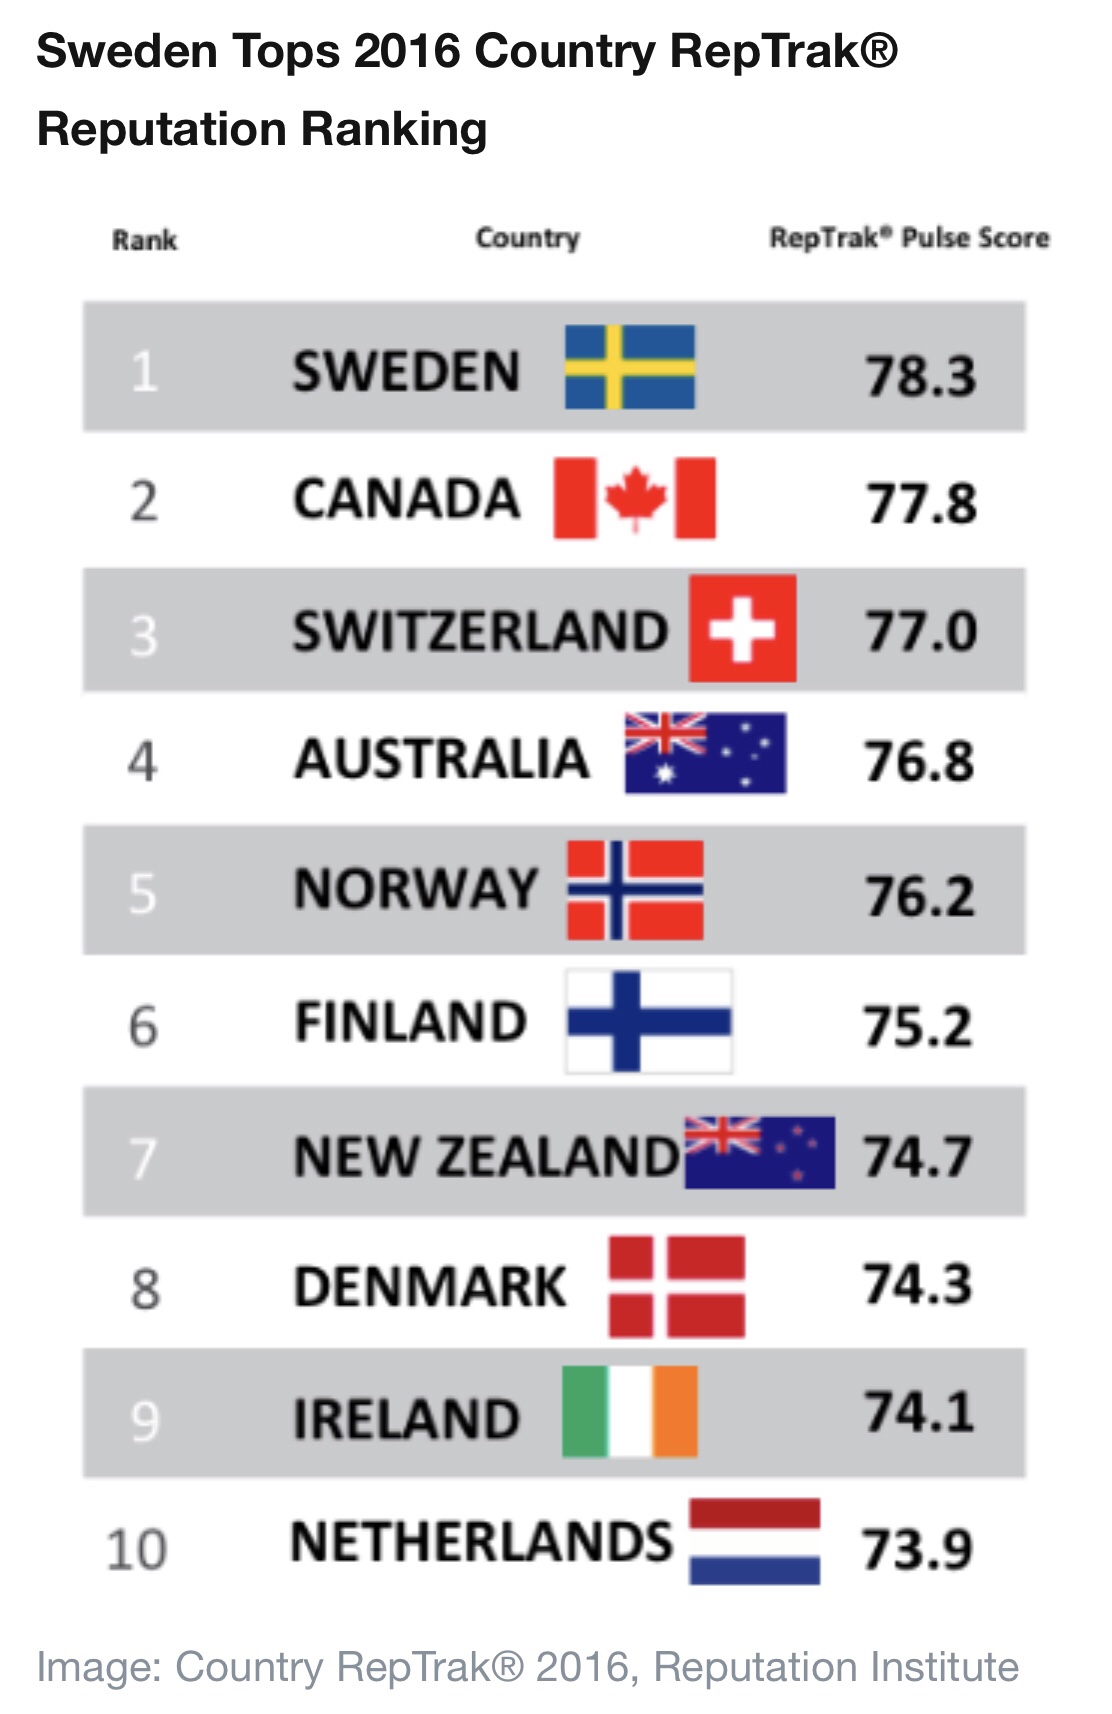
It has the best reputation
It’s no surprise then, that Sweden tips the ranking this year (78.3 points), of the RepTrak reputation ranking. It’s a great place for families – it has 16 months of parental leave and free day care services – it invests in green living, has favourable economic growth, is a safe country for women, has transparency in the media and last, but by no means least – it’s a beautiful country.
Source: A.Gray
It is commonplace to emphasise that we are now in a new era of globalisation, marked by the rise in the importance of emerging economies. But what does this really mean?
Richard Baldwin, author of the Great Convergence, argues that what is new is the combination of northern technology and southern labour. But he adds that for the present, global value chains are still mainly regional. Intermediate goods like car parts are primarily moved around within a regional “factory” (North America, Europe, East Asia), and then final goods are shipped to the user. China is the exception to this rule with its use as a factory economy by the EU and US.
It is worth testing this idea by looking at the patterns in the data since 2002. We have organised world trade into country groups: North America, Europe, East Asia, South-East Asia, South America, Less Developed Countries, and the Rest of the World.
So then, who trades the most?
Well, the chart below provides a snapshot of the share each region had in world trade in 2016 and the changes since 2002. What we see is that the greatest shares of both imports and exports are accounted for by Europe, followed by East Asia, the Rest of the World (RoW) and then North America. Trade flows are calculated using UN COMTRADE import data.
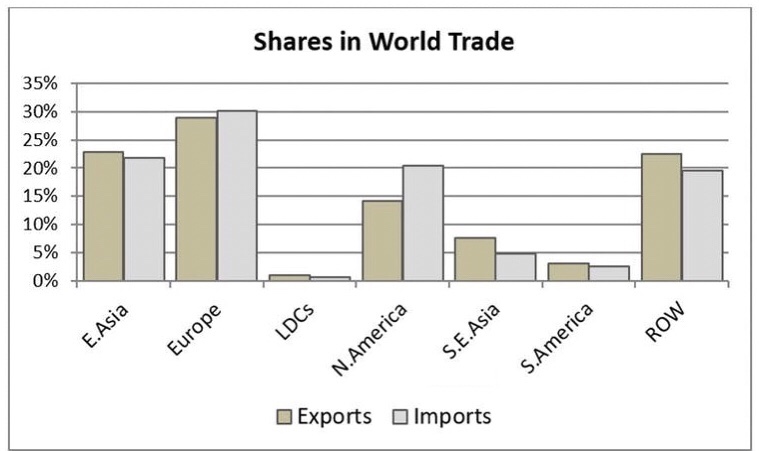
Image: The Conversation
The next chart gives the percentage point changes in these shares between 2002 and 2016. It shows that East Asia has increased its share by five points. The other big gainer is the Rest of the World, whose constituent countries have seen their share of world imports increase by three points and their share of exports increase by seven.
Growth here, and for South-East Asia and South America, reflects the growing importance of emerging markets. And this is backed up by declines in the share of imports and exports for both Europe and North America.
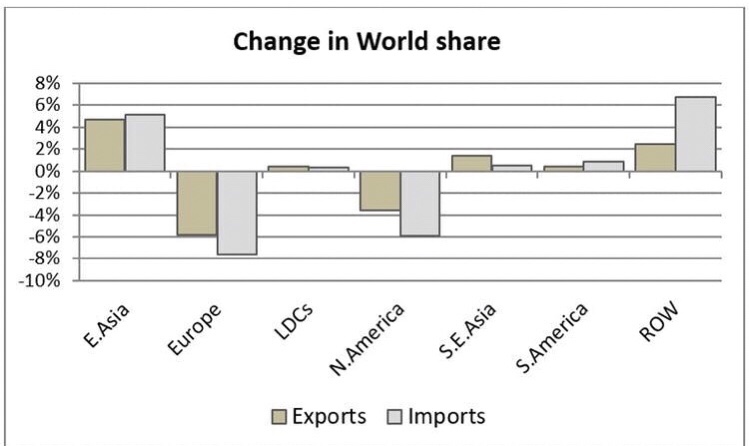
Image: The Conversation
Who trades with whom?
It is commonly argued that distance matters in international trade; that countries tend to trade most with countries which are closer. The fact that the cost of moving people hasn’t fallen along with the cost of moving goods and information may accentuate this. The heat map graphic below explores this.
Each matrix gives the share of trade between the partners. The darker the shade, the more important a trading partner is to that country. The top two tables show the state of play in 2002; the bottom two show 2016. Imports are on the left; exports on the right.
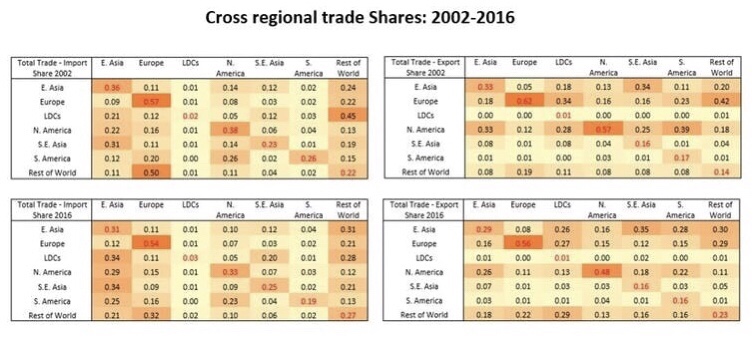
Image: The Conversation
One thing that is immediately clear is how Europe operates on a different level in terms of the intra-regional share of trade. In 2016, 54% of imports into European countries came from other countries on the continent. It’s at 56% for exports. The corresponding figures for North America, the next biggest, were 33% and 48%. East Asia comes in at 31% and 29%. It helps explain the hand-wringing over Brexit from businesses worried about even small barriers to this market. Just-in-time production methods are very vulnerable to border holdups.
That said, while intra-regional trade is important, and there remains much truth in the idea that global value chains are primarily regional, it appears this may be in decline. We have pulled this out into the graph below which gives the change in the intra-regional trade share for each of the regions. The only grouping which sees a rise in trade with itself is the RoW, and it’s fair to note that this is not a regional grouping geographically.
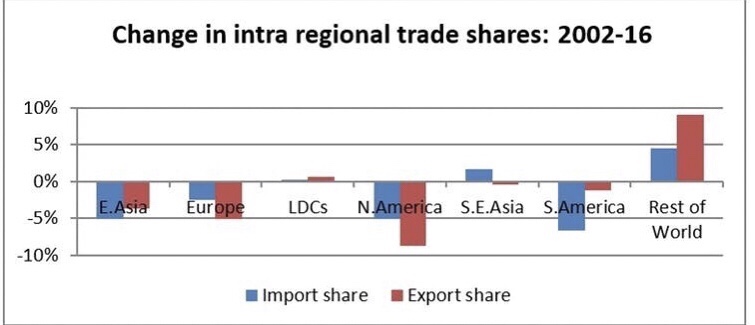
Image: The Conversation
More generally, the heat map table above shows a rise in the importance of the RoW countries as destinations for the exports of other groupings. Their share in the exports of East Asia has gone up from 8% to 18% between 2002 and 2016. For Europe it rose from 19% to 22%; for North America from 8% to 13%.
The role of intermediates
To truly understand the story we need to get a handle on trade in services and on intermediates. This market for things like the switches on a food mixer, or the consultancy work on a company merger have become more and more important in world trade.
The following chart gives the share of intermediates in total trade. From this we see an increase in the share of intermediates from 48% to 52%, and in total trade from 35% to 39%. In other words, more parts are being sourced away from where final products are manufactured.
We do see a slight fall in the share of services in total trade. Services figures are notoriously unreliable but these estimates are consistent with IMF and WTO estimate. In fact, much of recorded trade in goods reflects services embodied in goods, for example where software is used in design or manufacture.
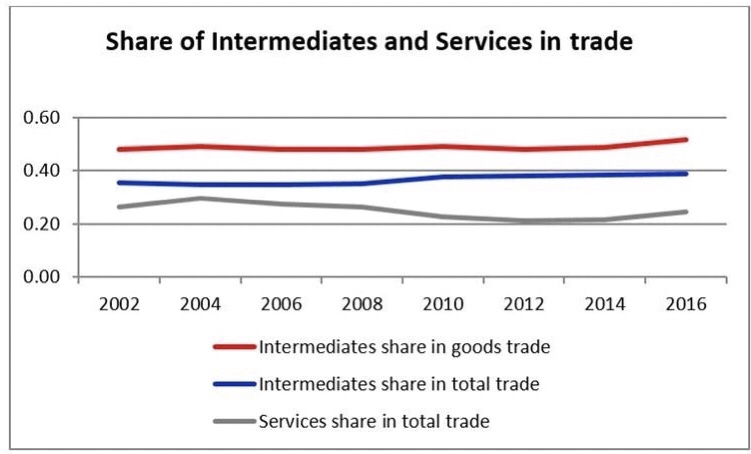
Image: The Conversation
Even for the growing trade in intermediates, the data show the same trend away from intra-regional activity. You might wonder if that’s just down to how we built the groups, but it’s not. The table below shows that even within categories of intermediates there remains a trend towards a slightly declining importance of intra-regional trade. It seems to be happening within almost all categories.
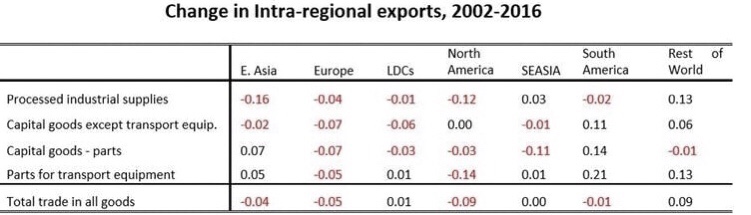
Image: The Conversation
What does all this tell us? Well, trade is still heavily regional. But China’s growing global role in the last 15 years has not prompted East Asia as a region to switch its focus to internal markets. And even Europe may be weaning itself off the dominance of trade between its constituent countries. Recent news about the US’ relationship with Canadian firm Bombardier might make you think North America’s regional favouritism is fragile too. Genuine protectionism from Washington in the future may have a deep and lasting effect on this data, but right now we are still moving towards – and not away from – true globalisation.
Source: WEF/Writers: Peter Holmes & Michael Gasiorek
You must be logged in to post a comment.